
-
Research Services<a class="dhimg1" href="/shichangdetail1/9.html" target="_self" rel="nofollow"> <img src="https://omo-oss-image.thefastimg.com/portal-saas/pg2026042316544414203/cms/image/8926ff01-64bc-4928-a995-396bdb9d8102.jpg" alt="Aniphe BioLab"> </a> <a class="dhimg2" href="/shichangdetail/8.html" target="_self" rel="nofollow"> <img src="https://omo-oss-image.thefastimg.com/portal-saas/pg2026042316544414203/cms/image/26342b34-4f1e-4d28-9166-7b685e6d70c3.jpg" alt="Aniphe BioLab"> </a>


-
Preclinical CRO<a class="dhimg1" href="/shichangdetail/6.html" target="_self" rel="nofollow"> <img src="https://omo-oss-image.thefastimg.com/portal-saas/pg2026042316544414203/cms/image/cc43bac1-07d9-4340-9677-fbe01c51330a.jpg" alt="Aniphe BioLab"> </a> <a class="dhimg2" href="/shichangdetail/10.html" rel="nofollow" target="_self"> <img src="https://omo-oss-image.thefastimg.com/portal-saas/pg2026042316544414203/cms/image/f1d8f739-0d36-4cb8-adeb-26de791d909c.jpg" alt="Aniphe BioLab"> </a>


-
-
-
-


Latest News
Focusing on cutting-edge technologies and research advancements,
sharing Aniphe BioLab’s achievements in scientific innovation,
Professional insights
and practical experience in the fields of laboratory animals and preclinical research.
Publish an article
How should a multi-disease composite mouse model be constructed? Let’s take a look at the CKM approach.
01 Pathogenic factors can be additive, but the phenotype is not necessarily so.
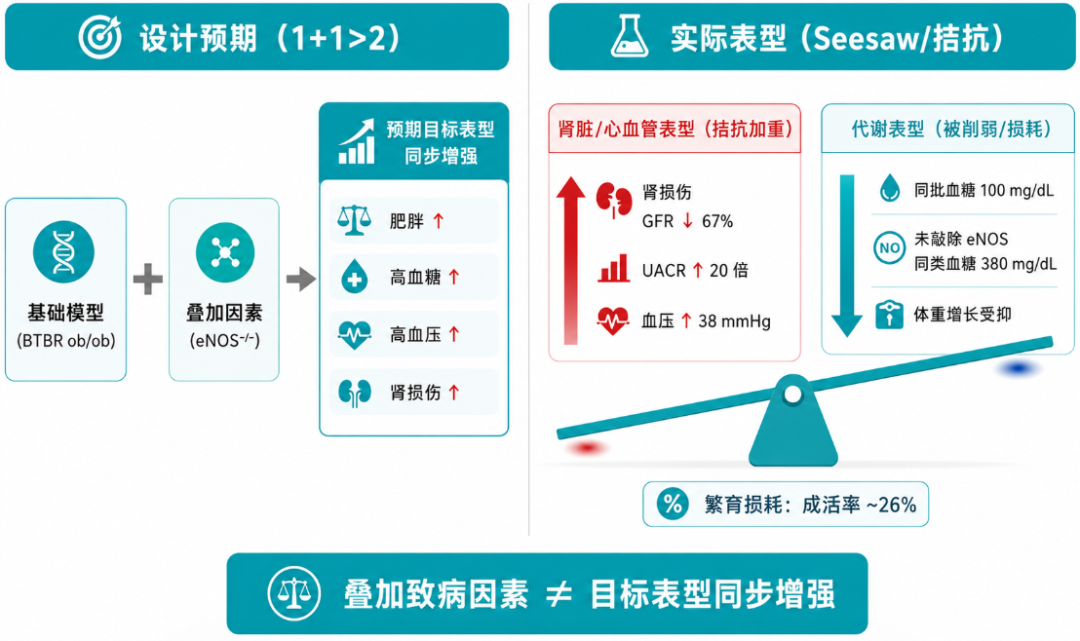
If one wishes to induce obesity, diabetes, hypertension, and dyslipidemia simultaneously in a single mouse, the most straightforward approach is to layer these pathogenic factors: use genetic defects to establish obesity and diabetes, knock out a gene to induce hypertension, and then feed a high‑cholesterol diet to elicit dyslipidemia. While this design appears rational on paper, the resulting phenotypes do not always worsen in concert when combined. Kanoo et al. further exacerbated renal injury by knocking out endothelial nitric oxide synthase (eNOS) in BTBR ob/ob mice [1]. The results were as expected: glomerular filtration rate (GFR) declined by approximately 67%, urinary albumin‑to‑creatinine ratio (UACR) increased roughly 20‑fold, and systolic blood pressure rose by about 30% (on average 38 mmHg higher in males). However, metabolic parameters showed the opposite trend: at 22 weeks of age, blood glucose levels in the eNOS‑knockout group were only around 100 mg/dL, compared with 380 mg/dL in their unmodified littermates, and body weight gain was also suppressed [1]. In other words, efforts to exacerbate the renal phenotype inadvertently weakened the diabetic phenotype that was intended to be preserved. The same study further demonstrated that only complete eNOS knockout led to elevated blood pressure; heterozygous animals did not exhibit the same changes [1]. Meanwhile, Wang et al., working in the context of Akita type 1 diabetes, found that even a moderate reduction in eNOS activity was sufficient to aggravate diabetic nephropathy [2]. These findings underscore that manipulating the same gene in the same direction can yield entirely different outcomes depending on the underlying disease model. Moreover, a study published in Nephron reported that only 58% of the target mice reached the desired cohort size at weaning, and this proportion further declined to 26% by the time of tissue collection at 27 weeks. Thus, adding multiple disease‑related risk factors poses a significant challenge to the large‑scale breeding of such mice.
02 The construction of a composite model requires consideration of two levels.
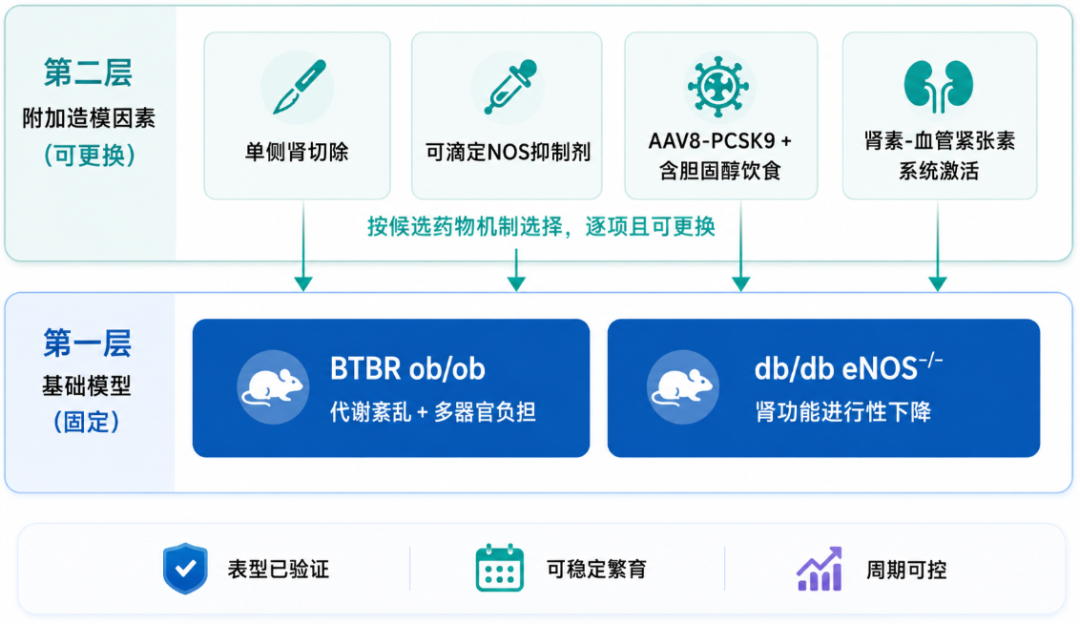
Since simple additive approaches are unreliable, a more practical strategy is to divide the model into two tiers: the base model provides a stable, literature‑validated disease context while ensuring breeding stability and controllable experimental cycles; additional modeling factors are then flexibly selected—such as surgical procedures, pharmacological agents, or viral inoculation—based on the candidate drug’s mechanism. This approach both preserves the stability of the base model and allows for tailored adjustments to suit different research objectives.
At present, we use BTBR ob/ob and db/db eNOS⁻/⁻ mice as two foundational models. Hudkins et al. reported that BTBR ob/ob mice develop proteinuria by 4 weeks of age, mesangial matrix expansion by 8 weeks, and nodular glomerulosclerosis—among other renal lesions—by 20 weeks, all in the context of obesity, hyperglycemia, and hyperinsulinemia [3], making them well suited for studying the progression from metabolic abnormalities to multiorgan damage. Zhao et al. demonstrated that, by 26 weeks, db/db eNOS⁻/⁻ mice exhibit a glomerular filtration rate (GFR) reduced to less than half that of diabetic controls, accompanied by elevated serum creatinine, increased blood pressure, and endothelial dysfunction [4], thus rendering this model particularly appropriate for evaluating the therapeutic effects of drugs on declining renal function. On this basis, additional modeling factors can be incorporated according to the specific research questions at hand.
03 Additional modeling factors are selected based on the drug’s mechanism of action.
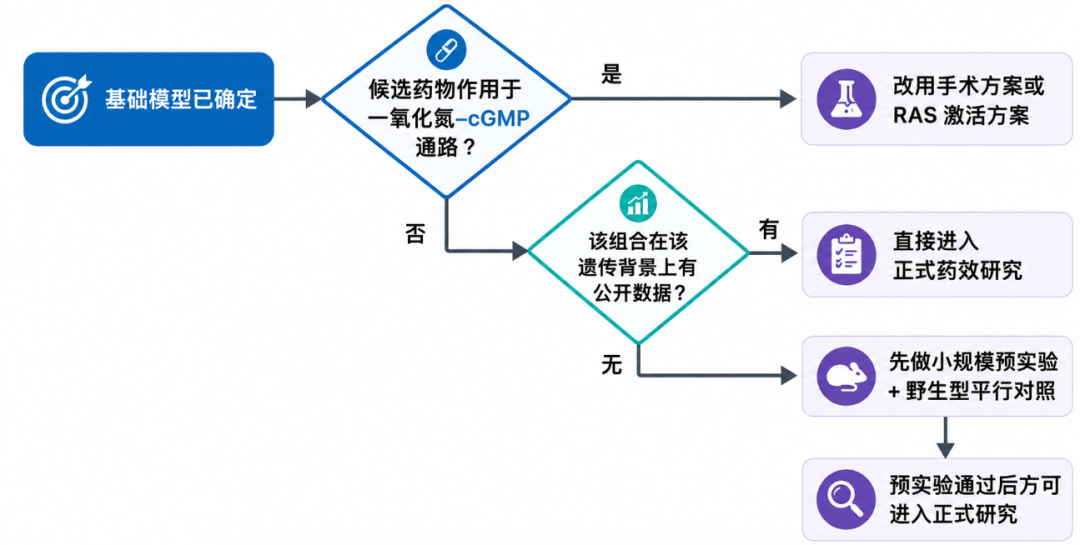
When selecting additional modeling factors, two key considerations are: which type of evidence needs to be supplemented, and whether the candidate drug operates within the same signaling pathway. A model that reliably recapitulates a disease phenotype is not necessarily the appropriate platform for evaluating a specific drug. If the modeling strategy and the drug’s mechanism of action target the same pathway, it becomes difficult to disentangle whether observed changes in efficacy stem from the drug itself or from the modeling process.
The table below, organized by four common categories of R&D issues, provides the corresponding configurations, potential risks to avoid, and currently available publicly accessible evidence.
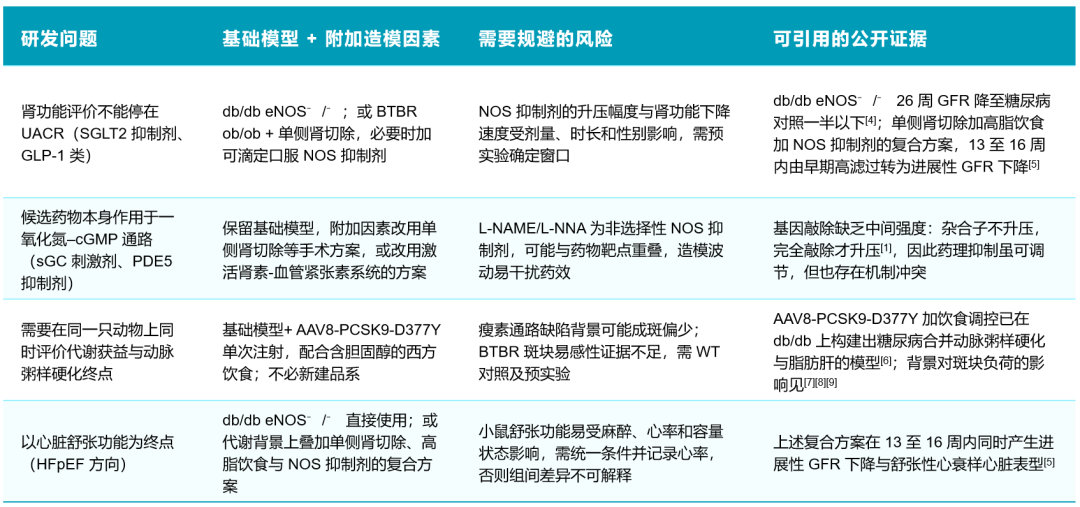
Furthermore, the genetic background of the mice and variations in upstream and downstream genes within the same signaling pathway can also influence the final phenotype. Therefore, for model combinations lacking established supporting data, it is advisable to conduct small-scale preliminary experiments first, including a wild-type parallel control group, to confirm the feasibility of the model before proceeding to formal pharmacological efficacy studies.
04 Indicators Across Four Evaluation Dimensions and a Phased Sampling Strategy
Once the base model and additional factors have been established, the next step is to determine what exactly has occurred in the animal and how these changes have unfolded over time. The evaluation phase addresses questions along four distinct dimensions; therefore, a clear chain of metrics must be constructed to comprehensively map the disease’s progression—from metabolic abnormalities and organ damage to functional alterations. Notably, the renal domain requires separate consideration: UACR, renal pathology, and GFR occupy three distinct levels and do not address the same issue. UACR indicates impairment of the glomerular filtration barrier, pathology reflects structural changes, while only GFR directly assesses function. Most models can reliably capture the first two levels, but achieving robust assessment at the third level remains the primary challenge.
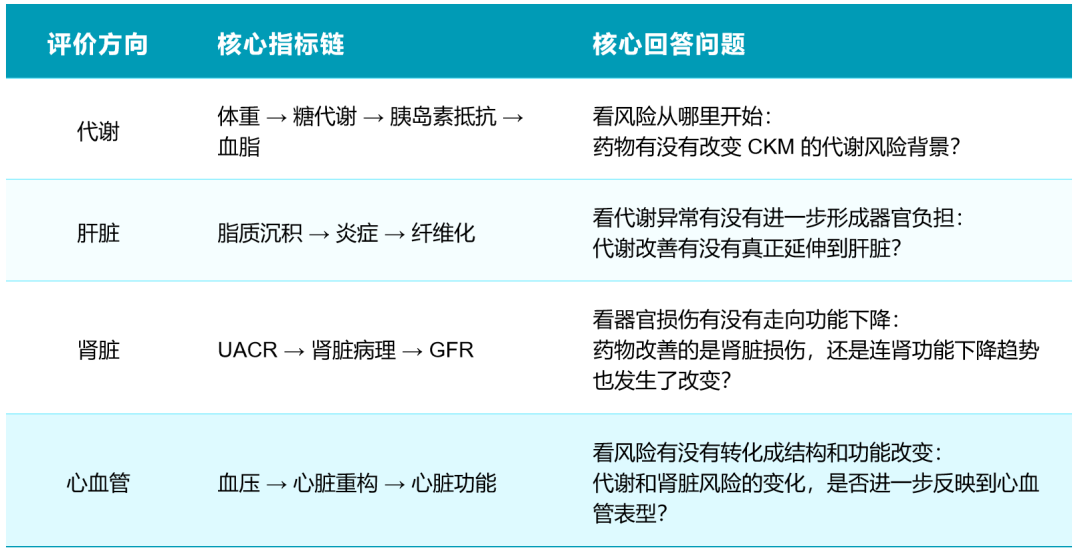
*The table above lists the indicator chains for each direction—indicators within the same row are arranged in a progressive sequence, rather than serving as parallel testing items.
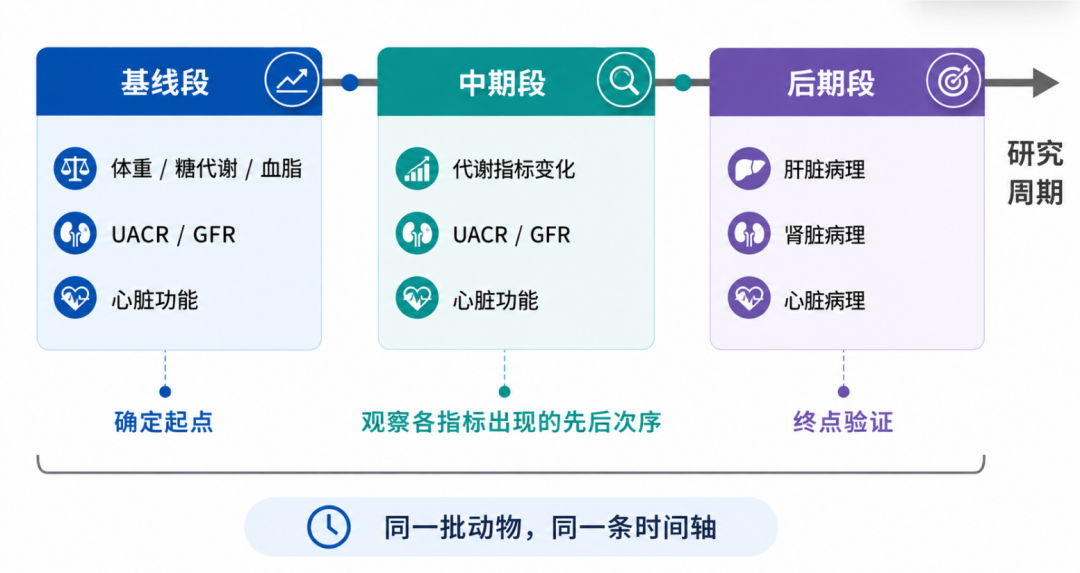
The indicator chain determines what to assess, while the sampling schedule dictates when to assess it. Within the same cohort of animals, samples are collected in three distinct phases: the baseline phase establishes reference values for body weight, glucose metabolism, lipid profiles, UACR, GFR, and cardiac function; the mid‑term phase examines the temporal sequence of metabolic changes, UACR, GFR, and cardiac function; and the late phase uses histopathological analysis of the liver, kidneys, and heart to confirm the endpoint. By evaluating the same animals at the same time points, one obtains a longitudinally traceable disease progression. In contrast, if only endpoint assessments are performed, it becomes impossible to discern how the disease evolves step by step; one would see only the final outcome.
05 Conclusion
The rational approach to composite modeling is neither to seek an animal with a fully developed phenotype nor to simply juxtapose multiple models with multiple endpoints. Instead, it requires aligning four key elements: a well-defined research question, a validated foundational model, a set of ancillary factors that do not conflict with the drug’s mechanism of action, and a stepwise evidence chain. Pathogenic factors may be layered, but the resulting phenotype will not automatically emerge; before adding any new layer, first determine what additional piece of evidence it will provide and what trade-offs it entails.
References
1. Kanoo S, et al. Deletion, but Not Heterozygosity, of eNOS Raises Blood Pressure and Aggravates Nephropathy in BTBR ob/ob Mice. Nephron 2024;148:631–642. doi:10.1159/000536522
2. Wang CH, et al. A modest decrease in endothelial NOS in mice comparable to that associated with human NOS3 variants exacerbates diabetic nephropathy. Proc Natl Acad Sci USA 2011;108:2070–2075. doi:10.1073/pnas.1018766108
3. Hudkins KL, et al. BTBR Ob/Ob Mutant Mice Model Progressive Diabetic Nephropathy. J Am Soc Nephrol 2010;21:1533–1542. doi:10.1681/ASN.2009121290
4. Zhao HJ, et al. Endothelial Nitric Oxide Synthase Deficiency Produces Accelerated Nephropathy in Diabetic Mice. J Am Soc Nephrol 2006;17:2664–2669. doi:10.1681/ASN.2006070798
5. van Koppen A, et al. A novel mouse model for cardiovascular-kidney-metabolic syndrome: Bridging metabolic, renal and cardiac dysfunction. Mol Metab 2026;108:102368. doi:10.1016/j.molmet.2026.102368
6. Xu M, et al. A novel mouse model of diabetes, atherosclerosis and fatty liver disease using an AAV8-PCSK9-D377Y injection and dietary manipulation in db/db mice. Biochem Biophys Res Commun 2022;622:163–169. doi:10.1016/j.bbrc.2022.07.031
7. Taleb S, et al. Defective leptin/leptin receptor signaling improves regulatory T cell immune response and protects mice from atherosclerosis. Arterioscler Thromb Vasc Biol 2007;27:2691–2698. doi:10.1161/ATVBAHA.107.149567
8. Nishina PM, et al. Atherosclerosis in genetically obese mice: The mutants obese, diabetes, fat, tubby, and lethal yellow. Metabolism 1994;43:554–558. doi:10.1016/0026-0495(94)90195-3
9. Getz GS, Reardon CA. Do the Apoe⁻/⁻ and Ldlr⁻/⁻ Mice Yield the Same Insight on Atherogenesis? Arterioscler Thromb Vasc Biol 2016;36:1734–1741. doi:10.1161/ATVBAHA.116.306874
PREVIOUS:
Aniphe BioLab Inc.
Address:
Runcheng, No. 8 Longtai Road, Jiangbei New Area, Nanjing City, Jiangsu Province
Building 8, Science Park
Postal Code: 210007
Phone:025-8520 8061
Email:info@aniphebio.com(Consultation)
Email:order@aniphebio.com(Order)


WeChat Official Account
Video Account
 Su Public Security Bureau Internet Information Service Filing No. 32010402001421